Hystrix服务监控Dashboard
发布时间:『 2019-04-29 06:03』 博客类别:SpringCloud 阅读(1014)
Hystrix服务监控Dashboard仪表盘
Hystrix提供了 准实时的服务调用监控项目Dashboard,能够实时记录通过Hystrix发起的请求执行情况,
可以通过图表的形式展现给用户看。
我们新建项目:microservice-student-consumer-hystrix-dashboard-90
加依赖:
<!--Hystrix服务监控Dashboard依赖-->
<dependency>
    <groupId>org.springframework.cloud</groupId>
    <artifactId>spring-cloud-starter-hystrix</artifactId>
</dependency>
<dependency>
    <groupId>org.springframework.cloud</groupId>
    <artifactId>spring-cloud-starter-hystrix-dashboard</artifactId>
</dependency>
<dependency>
    <groupId>org.springframework.boot</groupId>
    <artifactId>spring-boot-starter-actuator</artifactId>
</dependency>
application.yml配置
server:
  port: 90
  context-path: /
新建启动类:StudentConsumerDashBoardApplication_90
加注解:@EnableHystrixDashboard
@SpringBootApplication(exclude={DataSourceAutoConfiguration.class, HibernateJpaAutoConfiguration.class})
@EnableHystrixDashboard
public class MicroserviceStudentConsumerHystrixDashboard90Application {

    public static void main(String[] args) {
        SpringApplication.run(MicroserviceStudentConsumerHystrixDashboard90Application.class, args);
    }

}
这样就完事了。
我们启动这个项目;
然后浏览器输入:http://localhost:90/hystrix

出现这个 就说明OK;
然后我们来测试下;
我们启动三个eureka,然后再启动microservice-student-provider-hystrix-1004
我们直接请求http://localhost:1004/student/hystrix
返回正常业务
我们监控的话,http://localhost:1004/hystrix.stream 这个路径即可;
一直是ping,然后data返回数据;
用图形化的话

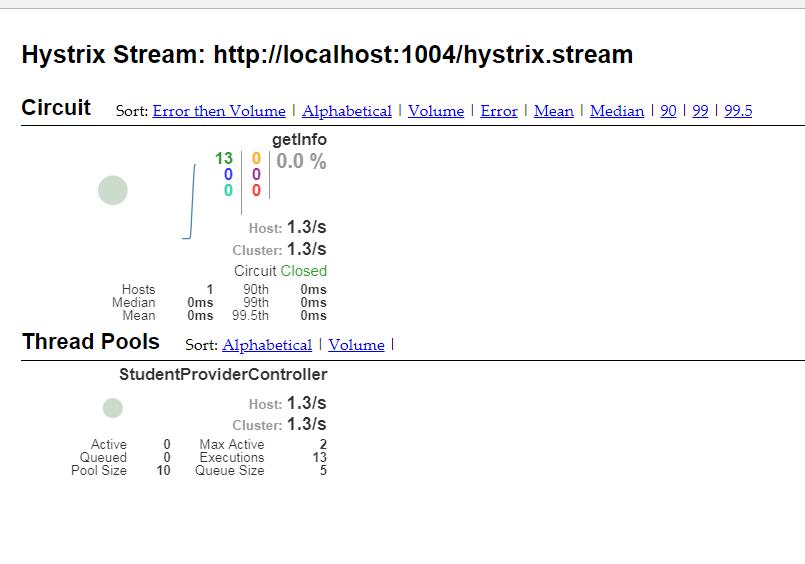
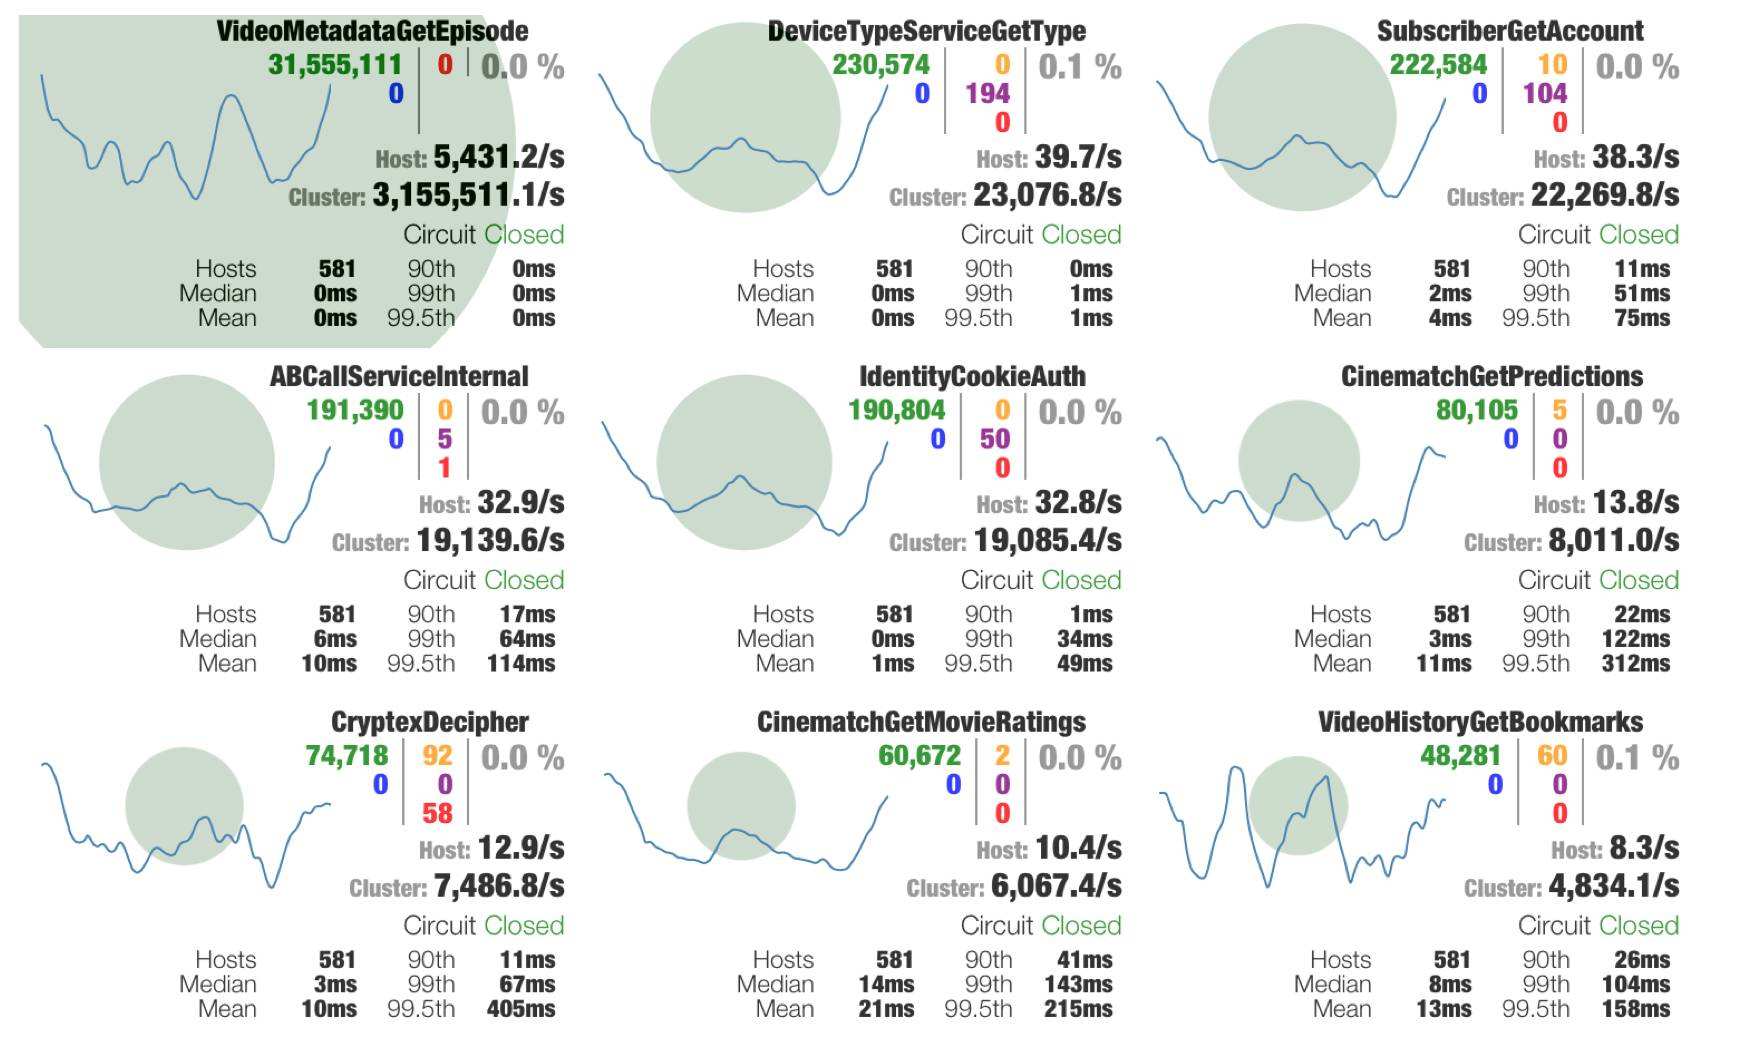
指标含义:

各种情况:
博主信息

javaxl_小李飞刀
(知识改变命运,教育改变生活)
备案号:湘ICP备19000029号
Copyright © 2018-2019 javaxl晓码阁 版权所有